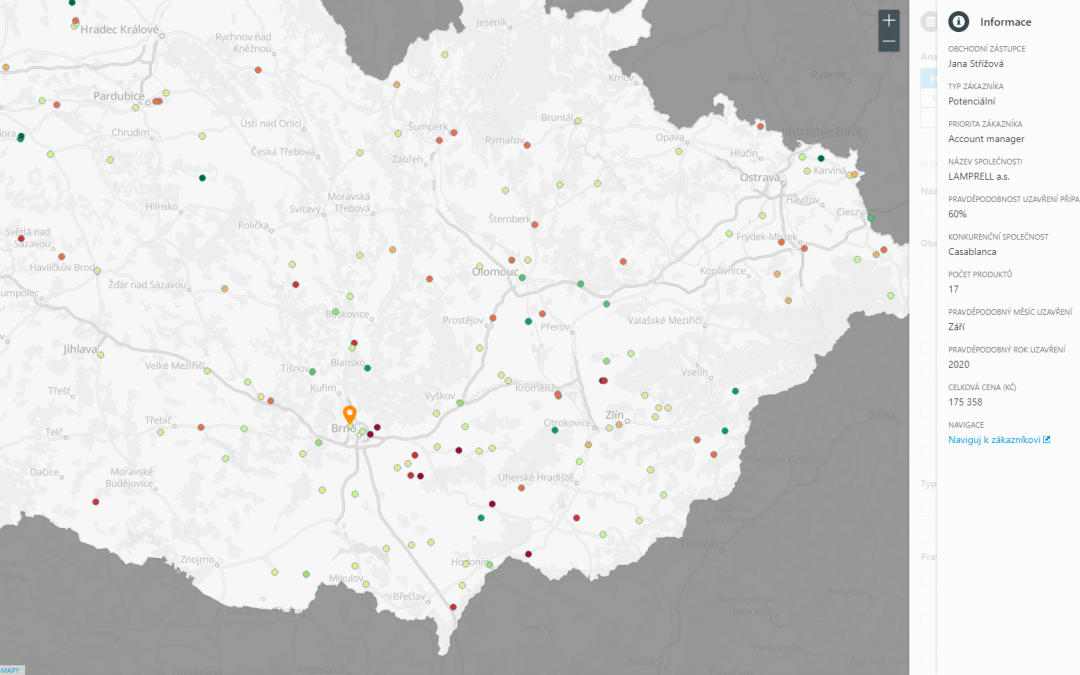
The values visualization is used to color-code points (customers) according to the code values from the data. The field according to which you will create the visualization...
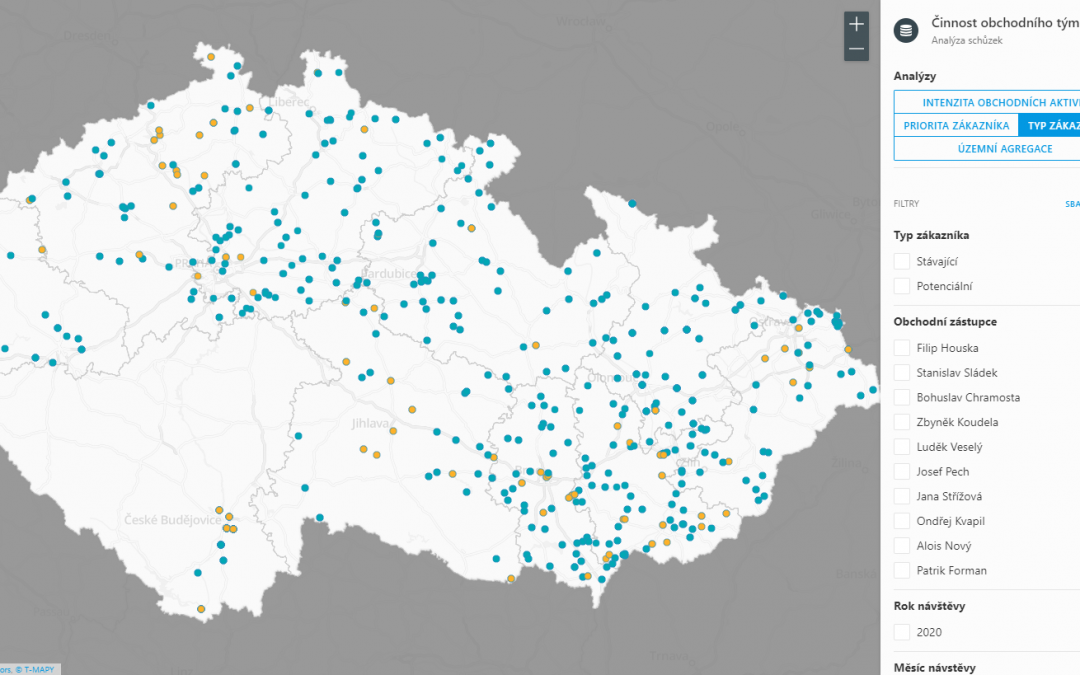
Values type visualization
read more
The values visualization is used to color-code points (customers) according to the code values from the data. The field according to which you will create the visualization...
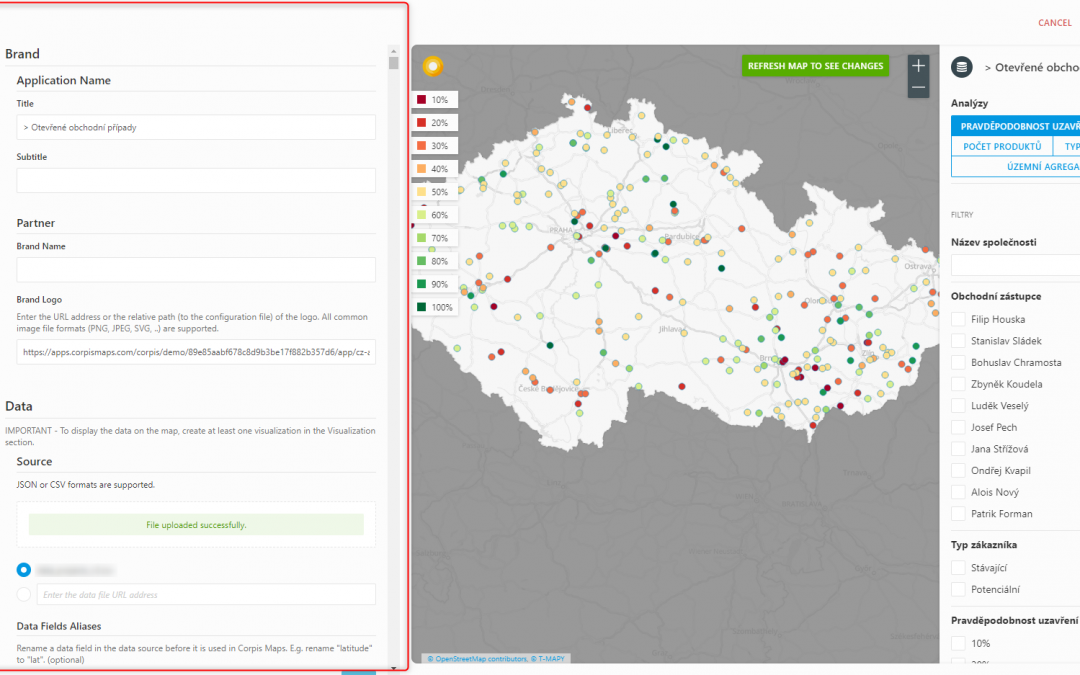
The configuration part of the map offers two options: form and code, between which you can switch freely during creation. 1. FormUse the form to create an entire map. From...
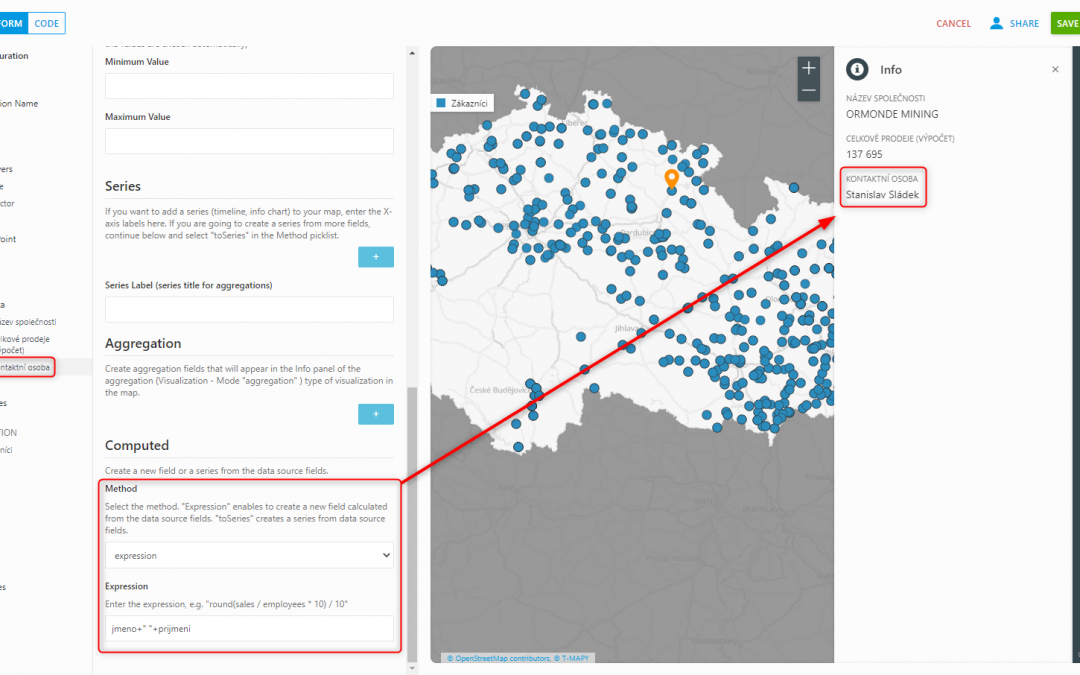
If you want to calculate in the map, or put more fields together, you do not have to perform it in the data source, but simply create it directly in the configuration part of the...
An important part of creating a map is adding new metadata. Everything you want to display on the map, whether it's customer information, filters, certain types of...
1. Add a Data Source Click on "Create new map" in your Corpis Maps portal account. An empty configuration part of the map will open. In the "Source" section, upload the data file...
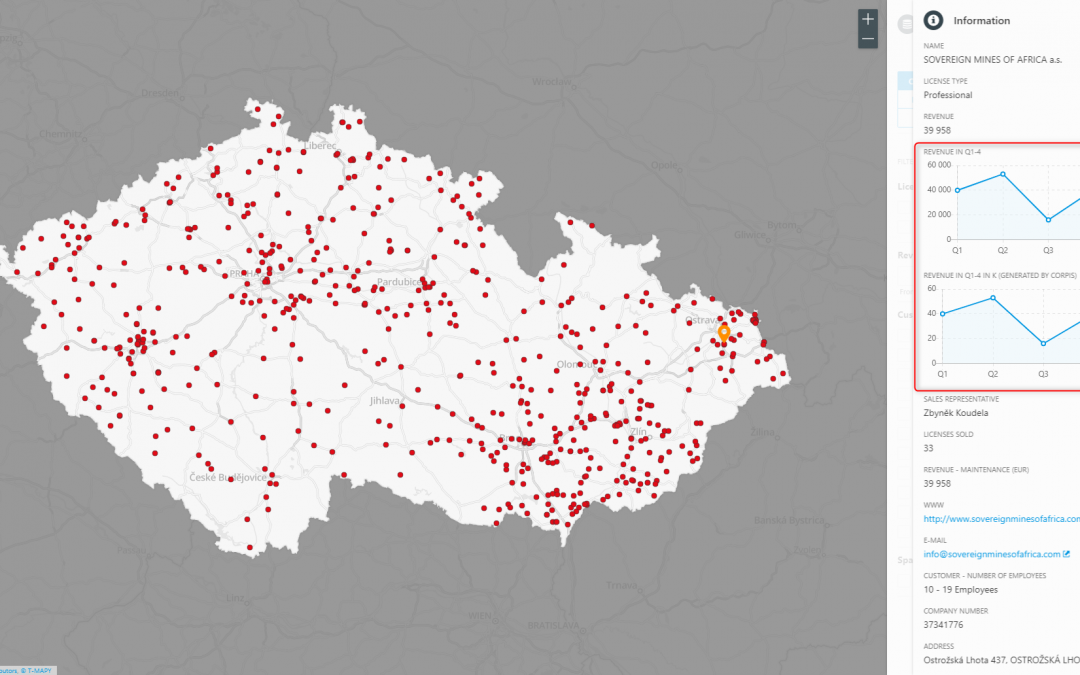
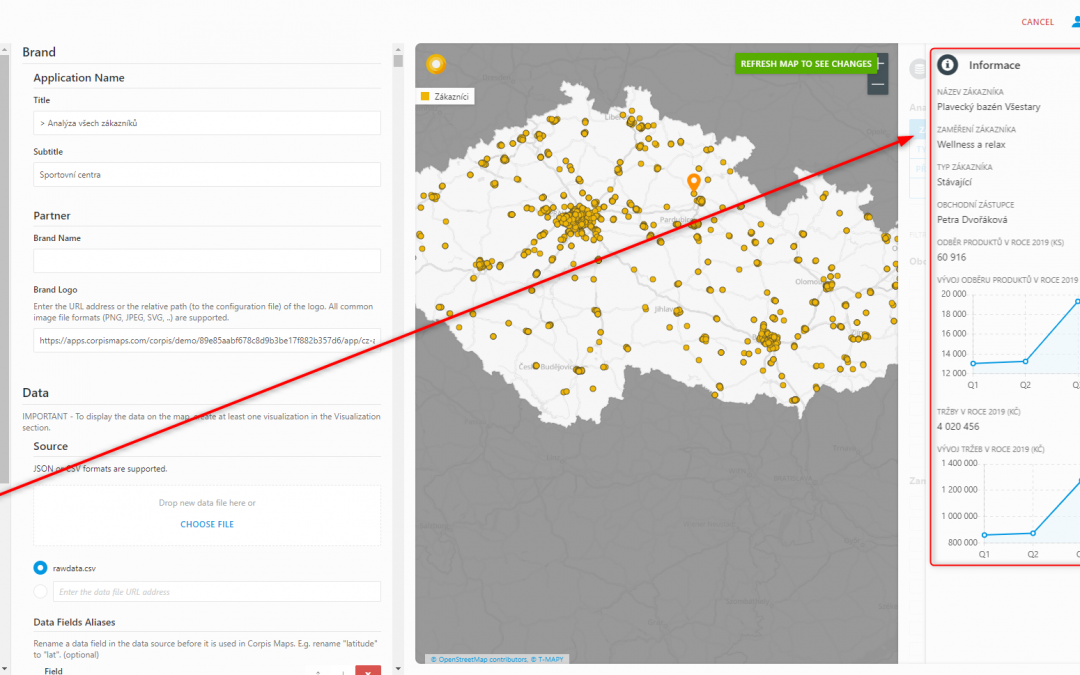
The graph of the development of the selected metric (for example sales) for certain time periods can be easily added to the info panel, which will be displayed after clicking on...
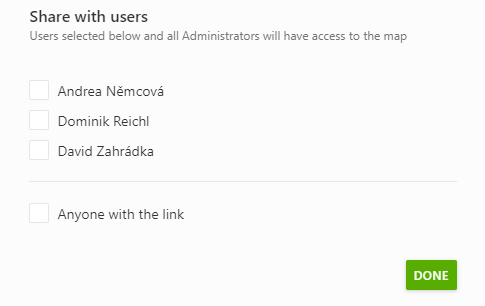
The sharing feature allows you to share the map with selected Corpis Maps users or publicly. Only a user with an administrator account (ie a user with map editing rights) can...
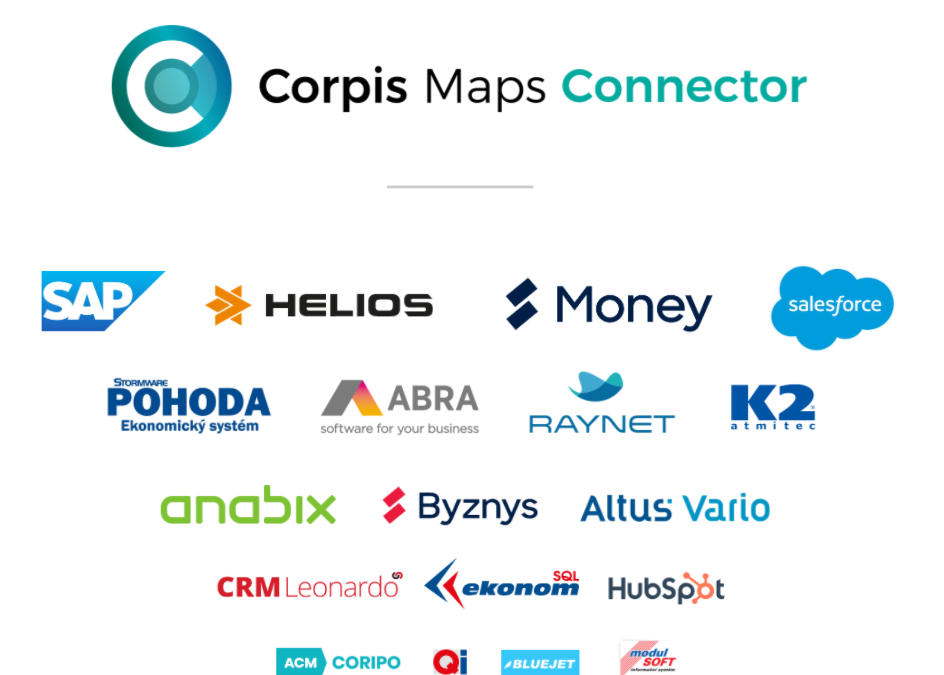
A new version of Corpis Maps has been released!In this article we will introduce you to the main news. Corpis Maps Connector - Automate data preparation Corpis...
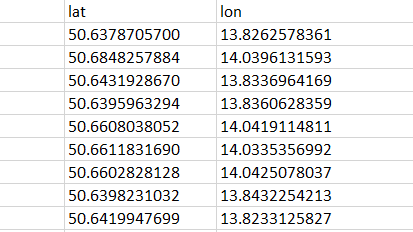
Every map is created from one data file, which has to containt coordinates of points (e.g. Customers). If the map should work fine, you need to make sure that two simple...

New version of Corpis Maps has been released. "In last months, we have been working hard on the most important innovation in the history of the Corpis Maps product. Our goal...