The new functionality is especially suitable for one-off projects, such as area acquisition meetings with potential clients or business campaigns. Corpis Maps covers the entire...

The new functionality is especially suitable for one-off projects, such as area acquisition meetings with potential clients or business campaigns. Corpis Maps covers the entire...
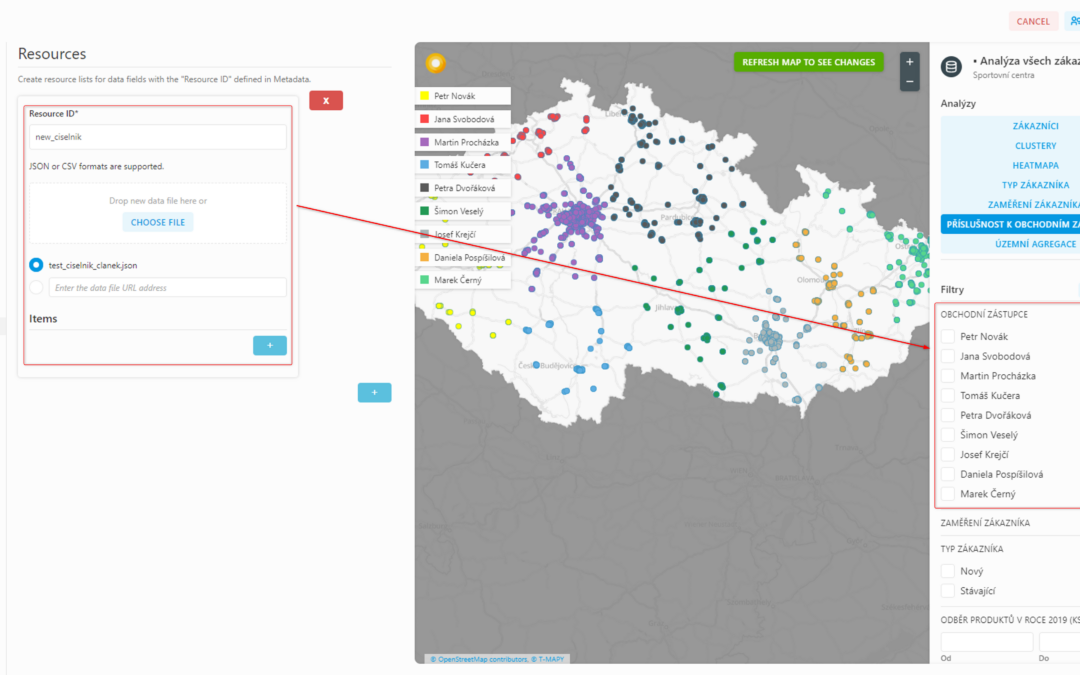
You can use the external code list to quickly and efficiently add a large number of items or if you generate the code list automatically, for example from a database. We have...
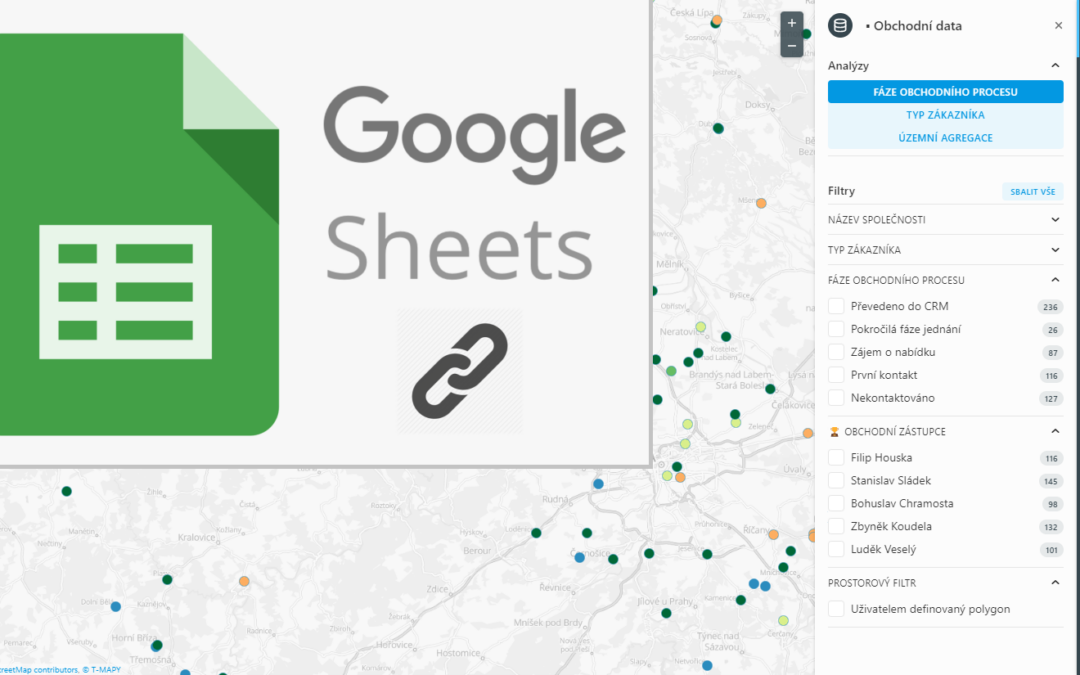
Corpis Maps now allows you to edit the data that is loaded into the map! The user can immediately enter important information and data into the company's information system or...
To log in to Corpis Maps, visit: https://app.corpismaps.com using your email address and password. The first time you log in, you will use the generated password, which you will...
⭐ Corpis Maps for all CRM systems Great news for all users of web CRM systems! The latest version of Corpis Maps allows direct integration into CRM! As a user, you will no...
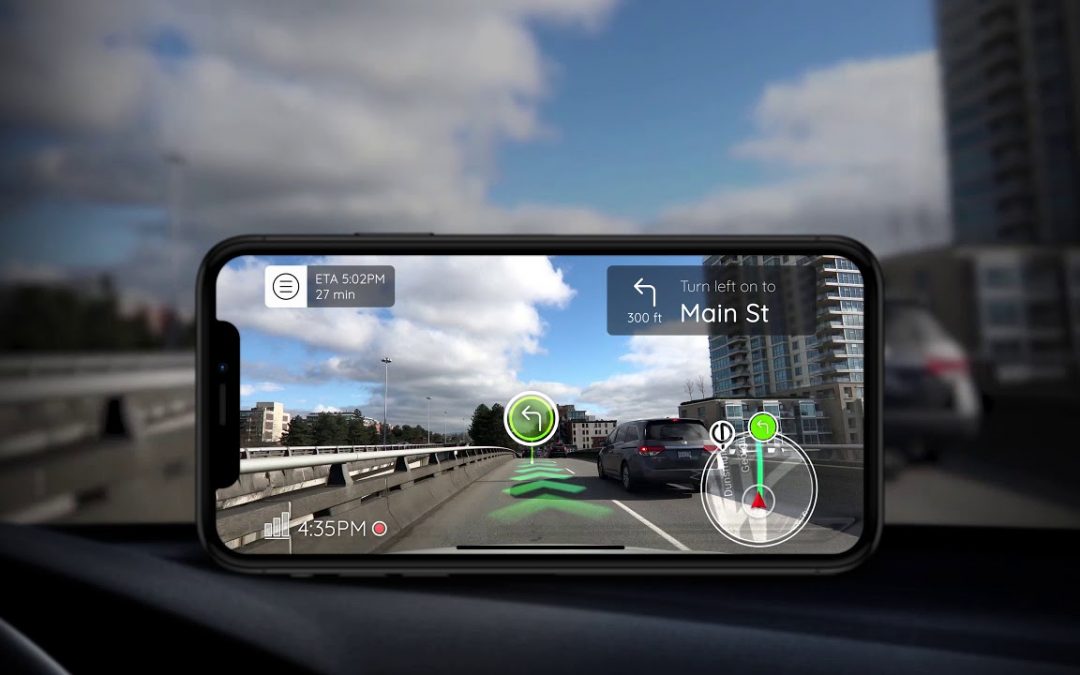
A novelty that every sales representative will surely appreciate! If you work with a map of customers in the field on your mobile device, then after clicking on the customer, you...
Artificial intelligence comes to Corpis Maps map analytics! Imagine it as a personal assistant who will think of a lot of things for you with incredible precision and foresight....
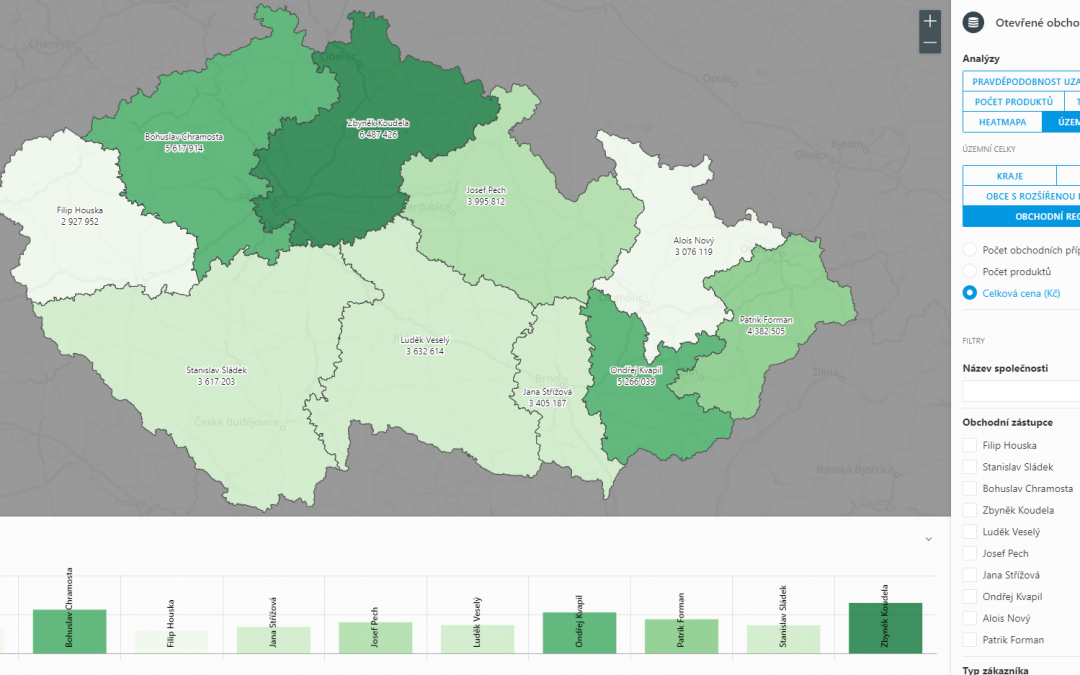
Creating an aggregation function To add a visualization of the aggregation type, it is necessary to add the field according to which you want to aggregate to the "Data -...
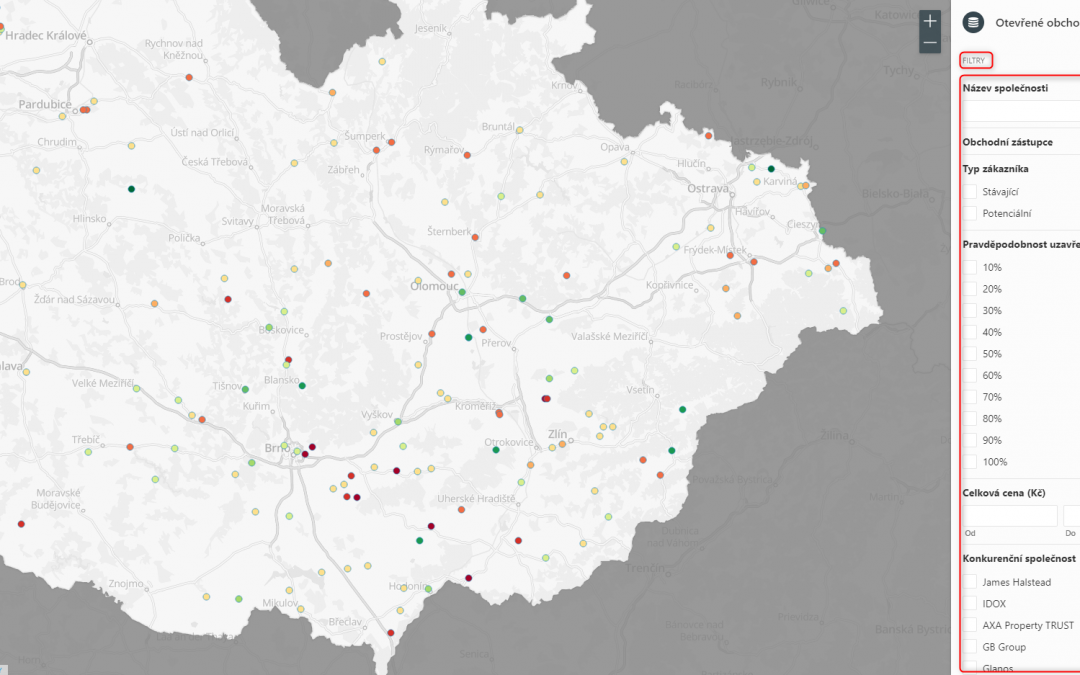
When adding a new field to the metadata, it is important to choose a format that serves to display the values on the map correctly and also defines the type of filter. To add a...
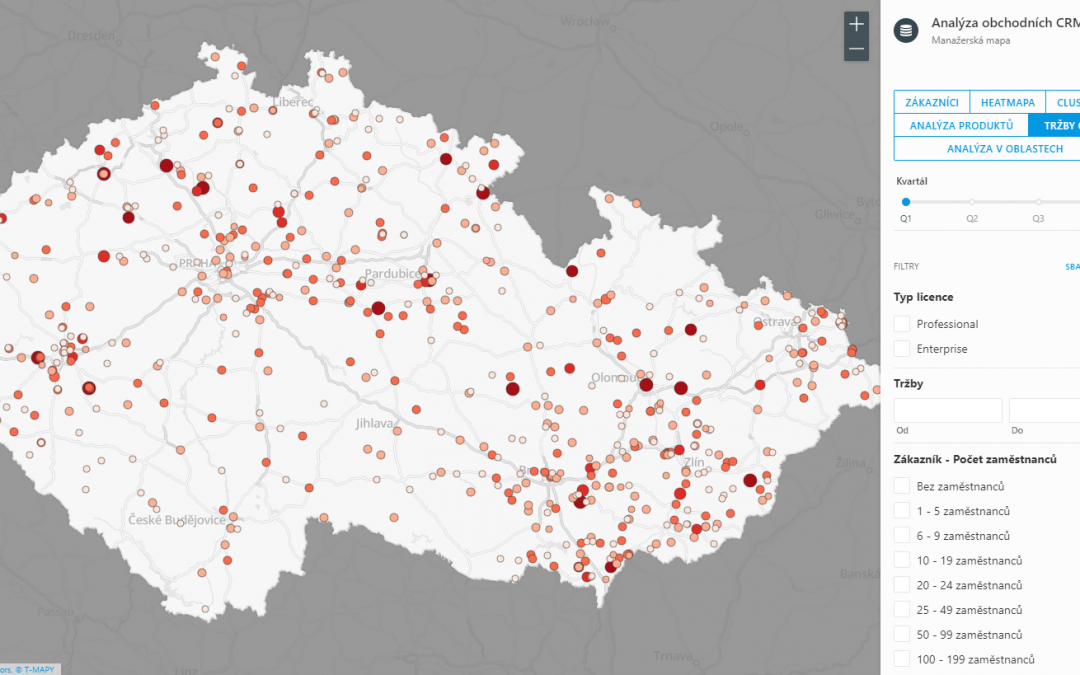
The breaks visualization is used to differentiate points (customers) according to the numerical value of the field from the data. The numeric field according to which you will...